
Visualize Your Data Beautifully with Google Chart JS
Extending series of JavaScript library, we are going to discuss Google Chart JS.
Whether the dashboard of the Ajax application or web pages of websites, all of these digital platforms require proper graphical designing. However, graphical designing is a broad term that may include the integration of color, texture, shapes, graphs, maps, and chart features. Moreover, the design depends upon the programming language whose coding is being integrated at the back-end of websites.
Thus, JavaScript, being a high-level programming language is most common among web designers. However, sometimes, web developers are tired of putting extensive coding of JavaScript elements or classes. But JavaScript libraries and their design provided the best solution for web designers. Hence, Google Chart JS is one excellent graphical library that creates graphical charts.

Being the most integrated library of JavaScript, it builds the charts by using supplied information. Thus, the JavaScript embedded web pages create charts according to user information and also provide images. Hence, being a browser template, it provides relatable chart images, suited best to user’s information. So, to fulfill the needs of graphical live display charts, a team of Google developers co-worked. and came up with the best solution for the Google Chart JS library.
Creating Charts with Google Chart JS
Google Chart JS lets you make different interactive charts easily. Here are some key things about it:
- You can make many chart types like bar, pie, and line charts. This allows you to visualize data in different ways.
- The charts work on desktop and mobile devices. So they look good on all screens.
- Chart.js uses HTML5 canvas to make the charts. This makes them fast and compatible with modern browsers.
- The API is simple to learn. You just provide the chart type, data, and options.
- It is free and open source. Developers can contribute to the project.
- There is good documentation with code examples to help you get started.
- Chart.js is lightweight. You don’t need other libraries or plugins.
- You can customize charts to make them interactive and engaging.
- It works well with frameworks like React and Angular. There are wrappers to integrate it.
In summary, Google Chart JS makes it easy to add animated, interactive charts to sites and apps. It’s a great open source JavaScript charting library.
Astonishing Features of Google Chart JS
Due to simple integration in the previous coding, it attracts 90% of web designers while working on data visualization of websites. However, a more astonishing feature is that of its free availability to download and convenient integration in JavaScript back-end coding. Being a powerful JavaScript library, Google Chart JS provides a wide range of rich galleries, containing functional data tools and colorful graphical charts types. Moreover, some other features which enhance the credibility of the graphical JavaScript library include:
Dynamic Data
The most demanding feature in graphical libraries is the data tools integration. Yes, these data tools can assist web designers to arrange and design charts by using Artificial intelligence. Hence, it enables the user to connect with data in real-time and provides a wide range of connection tools. But connection protocols are added to improve the display of data in various manners.
Controls and Dashboards
Each website and Ajax application requires a proper strategy for graphical designing of data visualization. Hence, it also integrates the different types of controls into the dashboard of Ajax applications. Through series of easily connected charts and live displays gives a glimpse look to dashboards. Moreover, the applied API saves the web designers from troubleshooting of writing again and again.
Rich Gallery
The most distinguishing feature which makes it more popular among web designers is a rich gallery. So, the wide range of charts in the gallery enables the designers to display the data in various forms. Hence, from simple to complex, all these charts include Pie, line, bar, scatter plots, curve, simple line, and hierarchical tree maps.
Animation creation for dashboards
Two-way animations of graphical charts integrated by Google Chart JS make dashboards attractive. Hence, the first strategy includes the selection of animation from the suggested gallery. Thus, the second strategy includes the first drawing of charts from the data-set and then the integration of animating features.
Customizable charts
Some previously designed charts require time to time modifications. Hence, those are required to be customized according to modern strategies. However, Google Chart JS only is the graphical library that enables the web designer to customize charts with more innovative features. With an extensive set of options, it is convenient to make the look of websites perfect.
Free Availability
All other graphical JavaScript libraries are paid for commercial use. but Google Chart JS is the only library that is freely available with a wide range of live display charts. Hence, with different Chart tools, the library facilitates web designers for free charts for the next three years. And also give three-year backward compatibility guaranteed.
HTML5 / SVG
Usually, websites need plugins to perform different functionalities for it. But Google Chart JS does not require any plugin for graphical data visualization and chart display. Thus, it makes the website compatible with Cross-browser e.g. VML and IE. So, it enhances cross-platform probability like for iOS and Android devices.
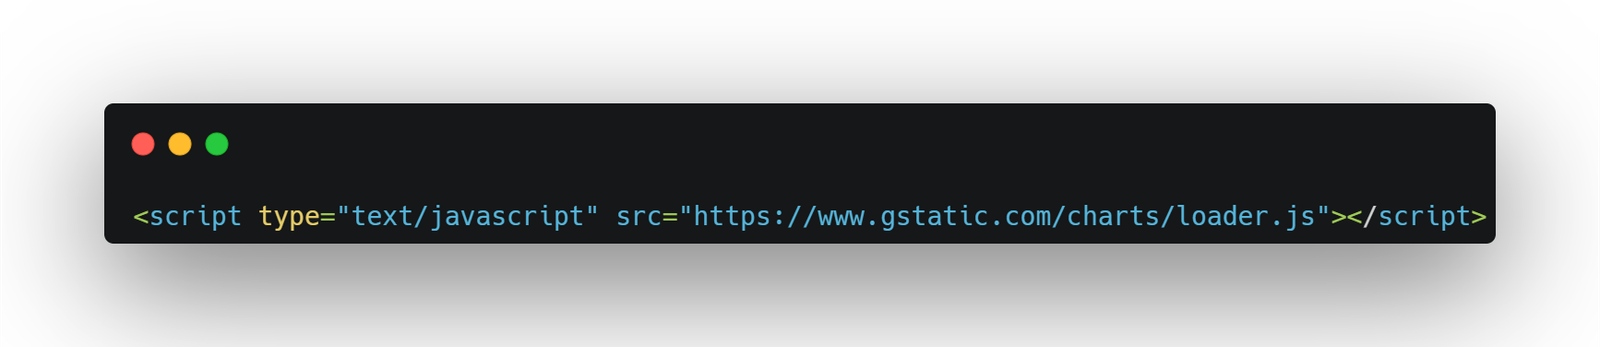
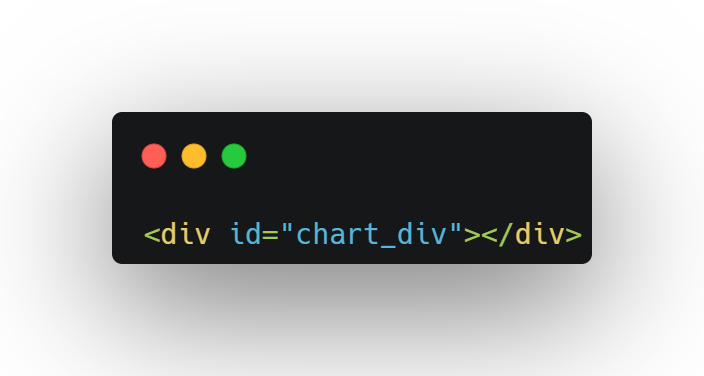
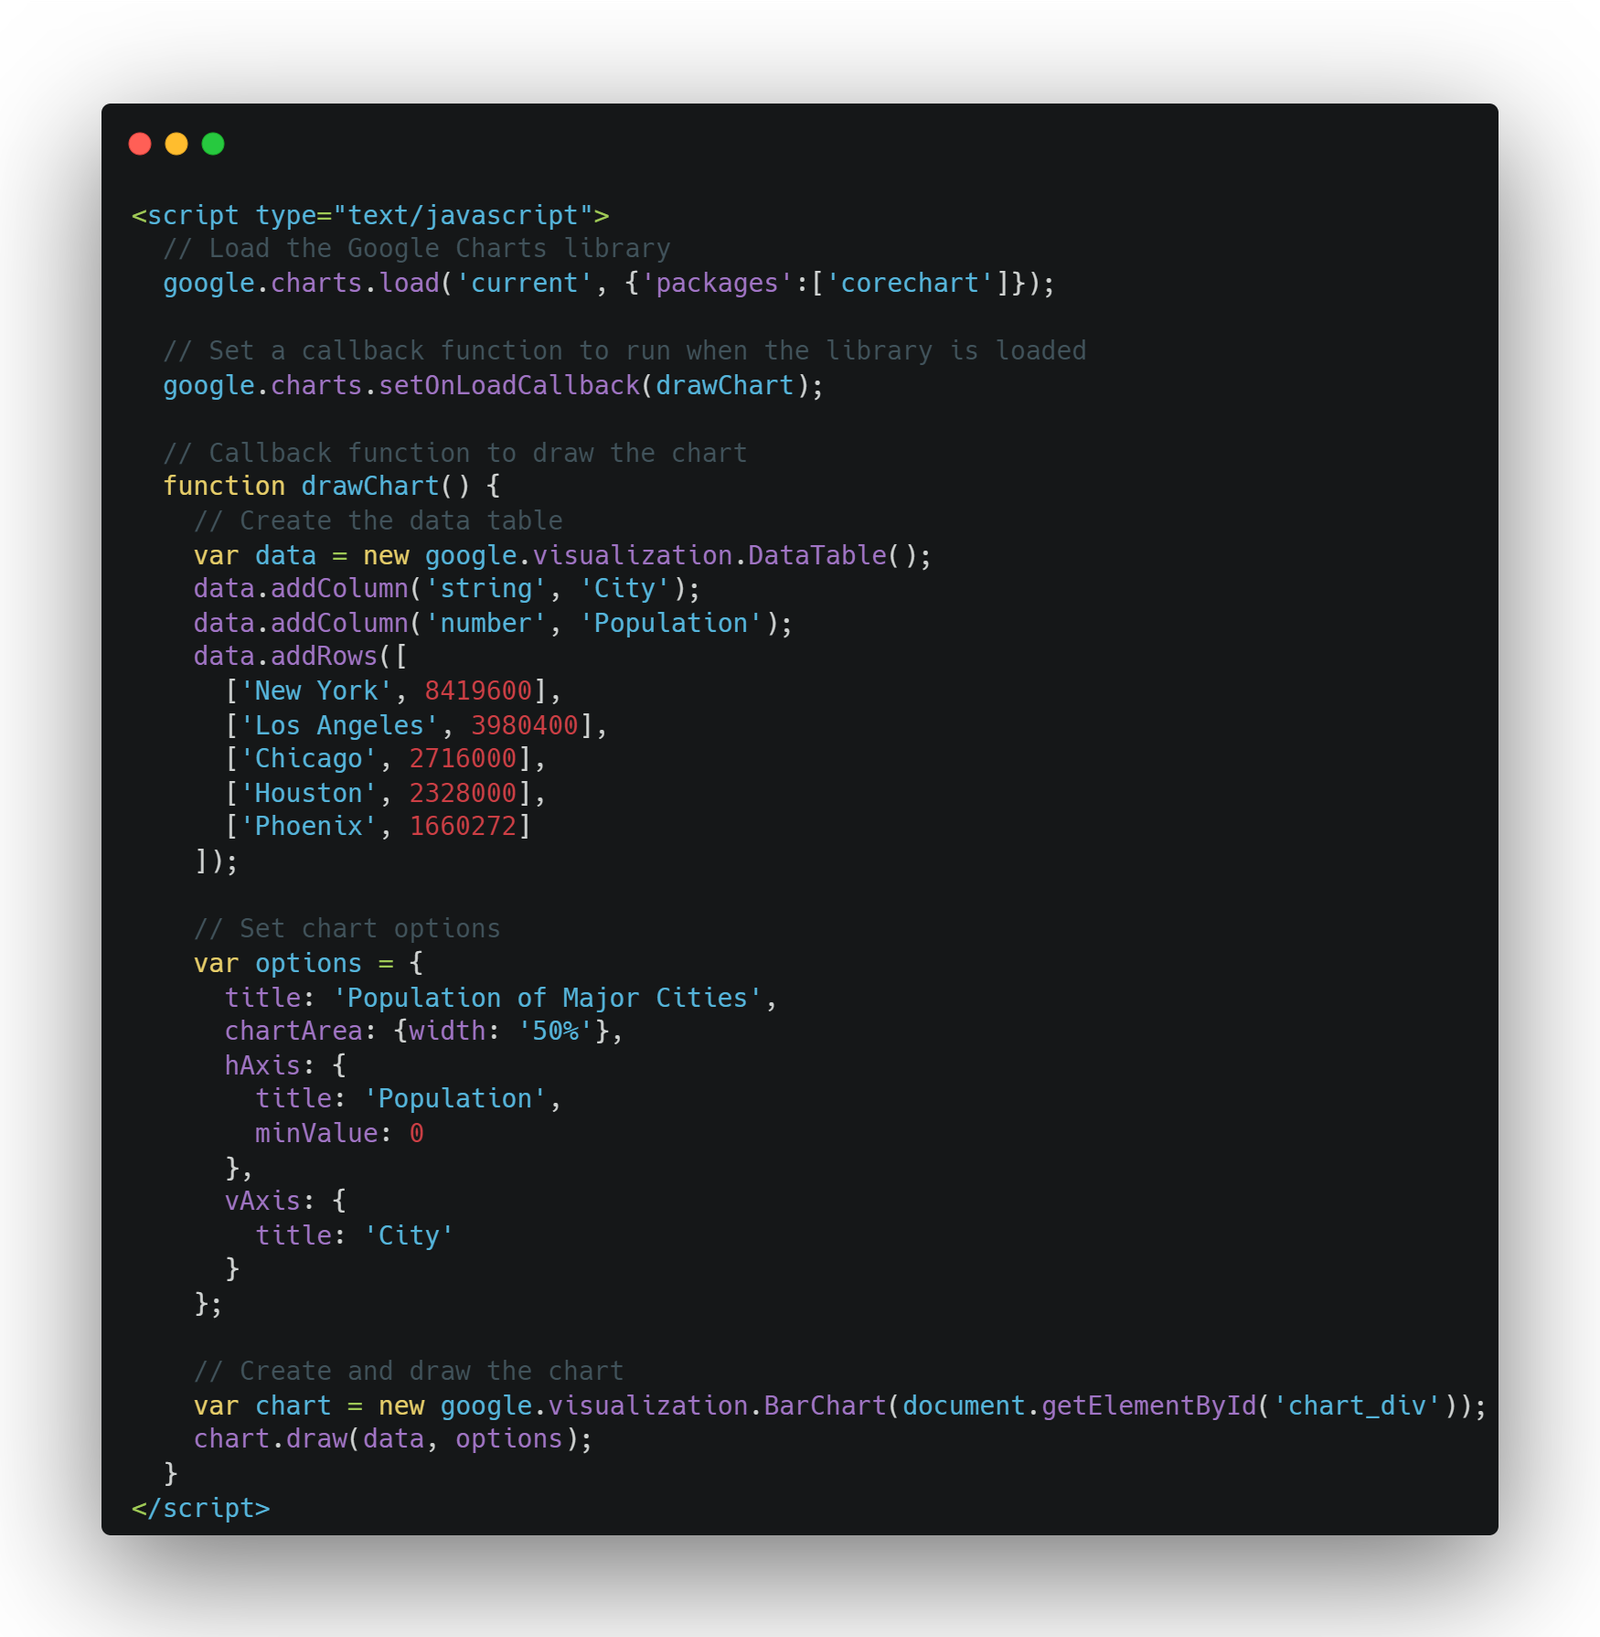
Google Chart Javascript Example
Conclusion
Display of live charts and integration of animations make Google Chart JS more demanding among web developers. Moreover, customizable, free availability, rich gallery, and interactive dashboards are distinguishing features that make it the most used JavaScript library.